|
|
|
Interpex is a software company dedicated to the production of high quality software for the processing, interpretation and display of geophysical data. |
|
P.O. Box 839 •
Golden • Colorado • 80402 • USA |
This site does not use cookies. We do not collect any personal information on this site.
Home Marine EM Seismic Processing Custom Development DOS Support
|
Electrical Methods |
Other Methods |
Support |
Updates |
Miscellaneous |
||
|
|
|
|
Ground
Probing Radar
Processing Designed
for Windows 9x and NT ® IXGPR is the successor to Gradix, our DOS based radar processing system. It was developed by disentangling the GPR module, GPR IXeTerra, from the Interpex "IXeTerra" Workbench to make a stand-alone module to be sold as shareware.
IXGPR™ screen showing Tree, Message Output Bar and two radar sections in the Application Area User Interface
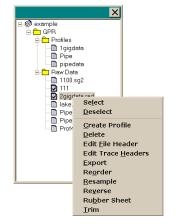
IXGPR ™ Data Tree showing the Raw Data and Profiles container, selected items and a ‘right click’ menu Data management is done by using the IXGPR Data Tree. The complete GPR project is displayed in the tree using two containers, RAW DATA and PROFILES. These containers provide the tools for organizing the data into logical groups and also serve as a spring board for accessing the processing and presentation functions. Branches of the Data Tree can be collapsed or expanded to maximize on screen real estate. The now common ‘Right Click’ is used to access the available options for any data object in the tree. In addition, a ‘Selection Flag’ is controlled by the user to indicate the status of any data object. These flags are used for selection during batch processing, plotting and other creation commands. Once the desired data object is located, a simple ‘double click’ will open the object in the IXGPR Application Area. While the data object is open in the Application Area the user is able to process and visualize the data. Data Import – RAW Data
Data Import list showing files to be imported. Multiple files types and locations are supported Wizard type technology guides the user through data import. Raw data can be imported from any disk-based device accessible to the PC. An import list is constructed and can point to different sources of data at the same time. All the data are then copied to the project directory and inserted into the RAW DATA container of the project. All commercial GPR instruments are supported. RAW data are defined as radar profiles to which geometry have not been assigned. The user has access to the data and the profiles can be viewed in the application area using default viewing parameters. Basic hard copy output is also available from RAW DATA. The RAW DATA container serves as a ‘holding tank’ for all data collected in the project. It is in there that data will be resampled, cropped, reversed, rubber sheeted, and in general be prepared for constructing profiles.
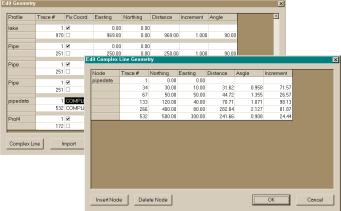
Geometry editing screens, showing project geometry at the back and the details of a single complex line in the foreground The use of selection flags opens the door for batch processing, plotting, and presentation. Sets of selection flags can be saved, making grouping and selective batch plotting possible. Data Import – Gradix Projects
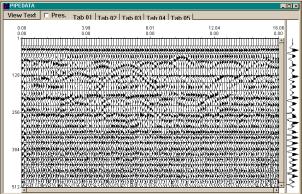
Data from a Gradix project showing tabbed windows with different profile versions Previous processing is preserved and Gradix Versions are displayed as tabbed pages on the same Window in the application area. This feature makes IXGPR ™ the ideal add-on to Gradix and overcomes windows printing problems with new generation printers. Data Processing and Presentation
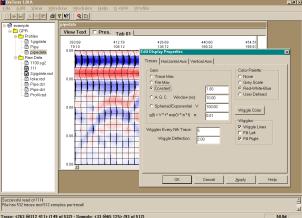
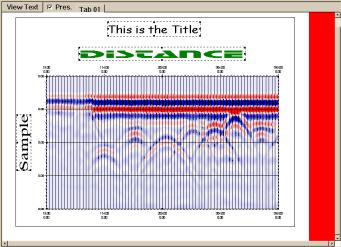
Application screen showing properties sheet for the Normal View Profiles are opened in the Application Area in a dual mode window. The Normal View is defined as being the data view where parameters are optimized for on screen analysis. Fonts, layout and menu options are chosen to be optimal for screen viewing. The Normal View is also the view in which data are processed and analyzed. The Normal View allows access to data zooms, panning and scrolling as well as a variety of gain controls. A single click takes the user to the Presentation View. The Presentation View is an instant ‘print preview’ of the data. In this view all options are optimized for paper hard copy. Complete control over display, layout, annotation, paper sizes, colors and fonts make setting up plots to exact user specifications easy. Careful attention to default preservation makes IXGPR™ the ideal tool for processing and presentation of GPR data, even if the only thing you do, is to print the data. Hard Copy
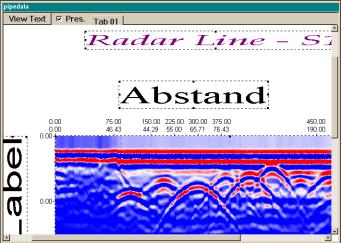
Presentation View showing plot components and resizing handles In addition to basic plots of RAW data, IXGPR™ utilizes the Presentation View to serve as the canvas to design hard copy plots to the user’s specifications. Using pre-defined templates, the plot lay-out is presented as if it where drawn on a piece of paper. Interactive positioning, scaling and font specification allows the user to modify the template and save it for later use.
Presentation view showing zoomed section with complex line annotation Full control is provided on annotation type, fonts, colors and positions of plot components. Interactive zooming allows the user to check plot detail before producing hard copies. Using the Windows print system ensures compatibility with all current printers supported under windows.
|
||
Copyright © 2018 Interpex Limited. All Rights Reserved