See also the newer Windows version IXGPR™
GRADIX is a Ground Penetrating Radar processing and interpretation package for IBM 386, 486 and Pentium based compatible microcomputers. GRADIX provides you with all the tools you need to read, edit, analyze, process, interpret, and output color plots of GPR data to nearly any color output device. Gradix allows you to read GPR data from most commercially available instruments, in manufacturers' formats, as well as SEG-Y and SEG-2 and user-defined formats. GRADIX runs in protected mode on 386, 486 and Pentium based machines with standard math coprocessor, 8Mb or more RAM and 100 Mb or larger hard disk.
Radar data courtesy of Sensors & Software, Inc. 1091 Brevik Pl. Mississauga, Ontario, Canada L4W 3R7. radar@sensoft.on.ca
and
Mala Geoscience, Skolgatan 11, S-930 70 Mala Sweden. geoscience@malags.se
Image size and quality have been lowered to reduce download time
GRADIX was developed to provide the geophysicist with a tool to process and interpret his GPR data interactively on a PC. GRADIX provides 256-color graphical display of GPR data, at the maximum resolution allowed by the graphics hardware, and features animated parameter selection together with the most comprehensive GPR processing package available.
GRADIX accepts GPR instrument files in the following proprietary formats:
GRADIX can export profiles or resampled profiles to all formats supported in the import section.
Profiles are located on the project map relative to their ground location. Multiple files can be combined into one profile.
Full support for topography is included by means of a spreadsheet-like editor that features smoothing and interpolation. Column-based files can be exported to form templates for topography editing in external packages. These files can then be imported to add true topography to the profiles.
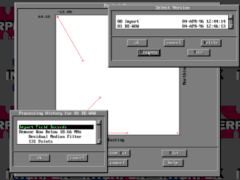
GRADIX is a project based processing system; all data are imported for a given project, and can then be selected and manipulated from a project map. The program maintains a database for each project.

Display from GRADIX showing the project map, loaded lines and the version and history pop-up boxes for the selected line
All processing and editing steps create new versions of the selected profile. This allows users to undo incorrect processing, do comparative processing and stepwise processing. GRADIX also allows the user to go back in a processing sequence and re-select a previous version and reprocess the profile using different parameters.
Each version of a profile contains a complete History listing of what was performed on the profile as well as a list of profile versions that the specific profile stems from.
Traces may be individually shifted, reversed, or killed. Subsets of a profile may be created simply by dragging the mouse over the profile display. Traces may be stacked.
Data display features are nearly unlimited. Traces are displayed in any combination of wiggle and color variable density display. The user has full control over color scales (load, save and create), display gain, horizontal and vertical scale, and annotation.
Display includes full panning and zooming capabilities, and a second profile facility for instant, back-and-forth comparison of profiles.
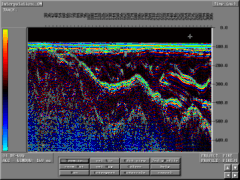
Main profile view screen showing GPR profile in grayscale
Profile display also allows the user to select a second profile to display in comparison to the first. The display is toggled between the two displays.
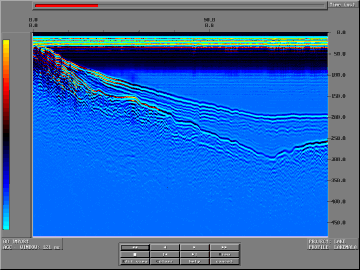
Gradix MOVIE viewer
GRADIX also offers a "MOVIE" display option. This option scrolls the profile on the screen in a continuous mode. Controls exist for fast forward, rewind and pause. Movie view is only available for variable density displays but vertical and horizontal scales as well as gain and color changes can be made.
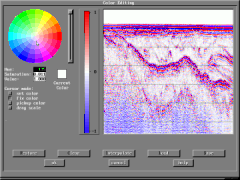
Interactive color editor to set up user defined color bars that can be saved
GRADIX offers an full color WYSIWYG print preview that allows you to set plotting parameters interactively. You see the plot as it will appear on the paper. Virtually all color and monochrome hardcopy devices are supported, as well as a variety of plot file outputs.
GRADIX also features annotation of entries in the anomaly database directly on hardcopy plots. User editable fields can be placed on the plots to mark anomalies.
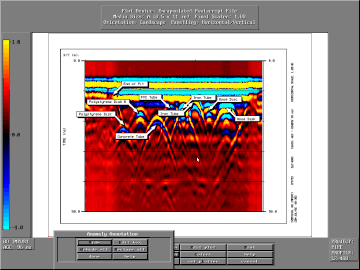
Plot Preview gives WYSIWYG display of hard copy output. Page frame is indicated to help user with Auto scaling and interactive editing of plot elements. Display parameters can also be set from the plot preview
Animated panels allow the user to select a subsection of the data, perform the desired processing on the subsection for a user-defined range of the processing parameters. The results are displayed using an animation feature that "pages" through the results using a slider bar. This allows for fast comparison of varying processing parameter results. Animation is available for:
Animated velocity panel showing CMP gather, slider bar and semblance curve. Click on the image to download an AVI movie that shows a velocity animation
GRADIX features a number of interactive processing screens where the data and processing operators are displayed on a graphical screen.
The user has the option of entering the operator parameters in data entry fields or use the mouse to manipulate graphical entities that are synchronized with the data entry fields. Once the desired operator is chosen the processing is carried out. All processing steps create a new version of the profile. The following interactive processing can be performed:
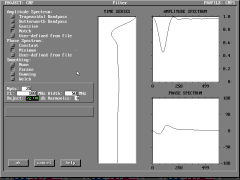
Interactive filter design screen displaying filter time series, amplitude and phase spectrum
All processing screens and pop-up dialog boxes have context sensitive help buttons to explain the current function. The user has the option to scroll backwards and forwards in the help system to previously viewed entries.
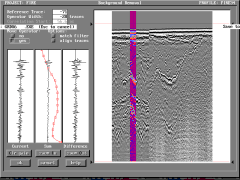
Interactive background removal screen
Another aspect of interactive processing is spectral analysis. GRADIX offers one and two dimensional spectral analysis with the option to plot the spectra.
Spectral analysis is done by choosing a subset of the profile in a profile view mode and then calculating the spectrum for the subsection. The FK Spectrum option allows the user to define velocity or multiple polygon filters and then view the filtered traces in comparison with the original selected portion of the profile.
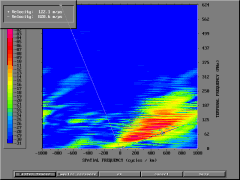
FK Spectral analysis screen showing spectra and controls for specifying velocity or polygon filters
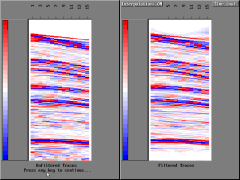
Screen showing pre- and post filtered traces after specifying a velocity filter in FK Analysis
In order to do a depth conversion the user defines a velocity profile. A velocity profile is a 2d section of defined velocities with depth that match the current profile in terms of location, length or depth.
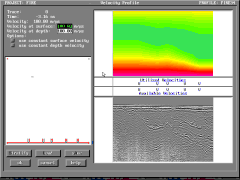
Interactive velocity profile setup screen displaying project map, available velocity functions, GPR profile and velocity section
GRADIX stores all velocity information in a velocity database. To construct a velocity profile, velocity records are extracted from the database and added to the velocity profile.
Velocity records are obtained from fitting hyperbolas or linear features, user defined records and CMP analysis using the animated panels.
Gradix also allows for non interactive data processing of profiles. This processing requires the user to define the processing parameters in data entry fields and then the data are processed according to these parameters. Each non interactive processing step also creates a new version of the profile.
Various tools are supplied for the interpretation of the data. Velocity interpretation by means of interactive hyperbola or linear fitting (tell at a glance whether a diffractor is below or above ground) add velocity records to the Velocity database that is used to construct velocity profiles.
Anomaly flagging involves point and click marking of anomalies from on profile. These anomalies can then be commented and the entries are stored in a Anomaly database that is displayed in the project map or exported to a external file that contains the time, depth, location and type of anomaly.
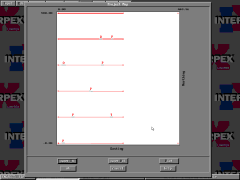
Project map showing profiles and "icons" indicating interpreted anomalies.