![]()
|
![]()
EMIX 34 Plus is designed for the interpretation of EM conductivity data acquired with the Geonics Ltd. EM31, EM34 or EM38 instruments. Forward and Inverse modeling is done on individual sounding stations and the results are displayed in profiles form. The results are in terms of apparent conductivity response.
EMIX 34
EMIX 34
EMIX 34
Layered Interpretation allows the user to interpret sounding data at each station in terms of a model with up to five plane layers. Results are in terms of apparent conductivity response for each configuration of frequency, spacing and coil height. This data is presented as apparent conductivity at low induction number, although the forward calculations account for the deviation from the low induction number assumption. The quadrature response of the earth is converted to apparent conductivity using eq. (2) from McNeill (Geonics Limited Technical Note TN-6. 1980) The in phase component of the field is ignored.
EMIX 34
Inverse modeling allows the user to obtain a model which best fits the data in a least squares sense. This is done using ridge regression to adjust the parameters of a starting model in an iterative manner.
You may constrain some of the parameters of the layered starting model so that they will not be adjusted by the inversion. Layers are fixed across sections of the model, not on a point by point basis. Starting models can have up to 5 layers; the maximum number of fixed segments is 5.
Inverse modeling of layered models can be carried out in batch mode. Accurate results are achieved even if the low induction number assumption is not satisfied.
EMIX 34
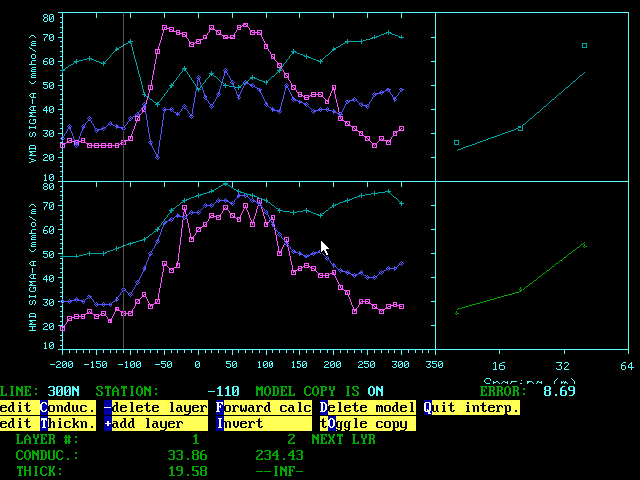
Interactive Graphics Interpretation screen showing full data set and individual sounding with calculated response
![]()
EMIX VLF is a presentation an processing package for VLF data. VLF field data can be presented as profiles and contour maps. Data can be filtered using either the FRASER or HJELT filters. Results are displayed as either contour maps, profiles or contoured profile sections. The main focus of the programs is to provide an interactive graphics analysis tool for users with VLF data.
See also the newer Windows version IXVLF
Apart from displaying VLF data EMIX VLF provides the user with two data filters. The FRASER filter converts cross-overs of the correct polarity into peak responses by differencing successive values of the tilt-angle along the survey profile.
The HJELT filter profiles are obtained by using the linear fit theory to solve the integral equation for the current distribution, assumed to be located in a thin horizontal sheet of varying current density, situated everywhere at a depth equal to the distance between measurement stations.
EMIX VLF was designed to read inphase and quadrature VLF data from instruments and files into a grid based data set. Easy to use editors allows for keyboard entry of data collected on a non digital instrument or for the editing of recorded data. Data sets are then saved in a binary file for quick and easy retrieval.
The program allows for the export of VLF data into XYZ ASCII files and printing of complete datasets as paginated text reports to any of the printers supported.
The main feature of EMIX VLF is the interactive graphics viewing screens. The first option is the single map view that allows the user to view a contour map of any of the following datasets:
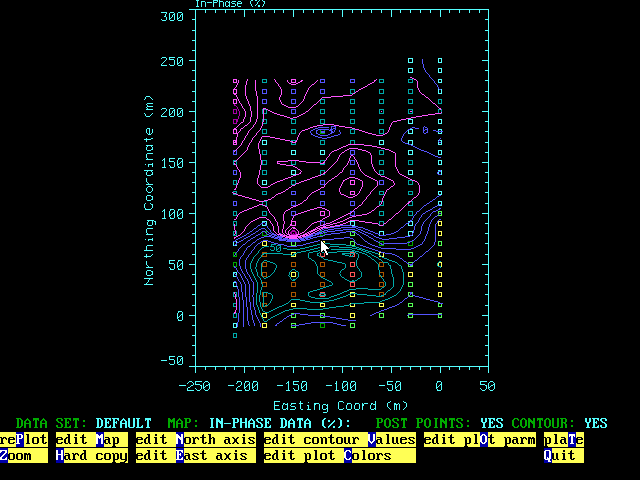
Interactive Graphics Screen showing contour map of data
The second interactive graphics screen allows users to display two maps side by side with interactive profile selection from the map displays. Any of the datasets available for viewing in the single map mode is available for either of the maps in the dual maps display mode.
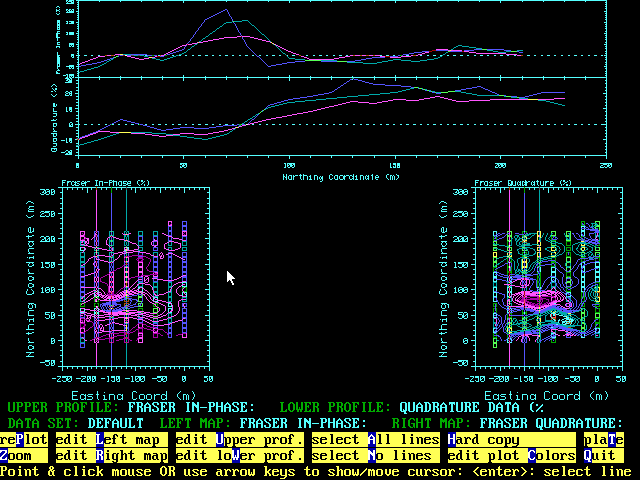
Interactive Graphics Screen showing contour map of data with selected profiles in top windows
Features available in both the interactive graphics screen include:
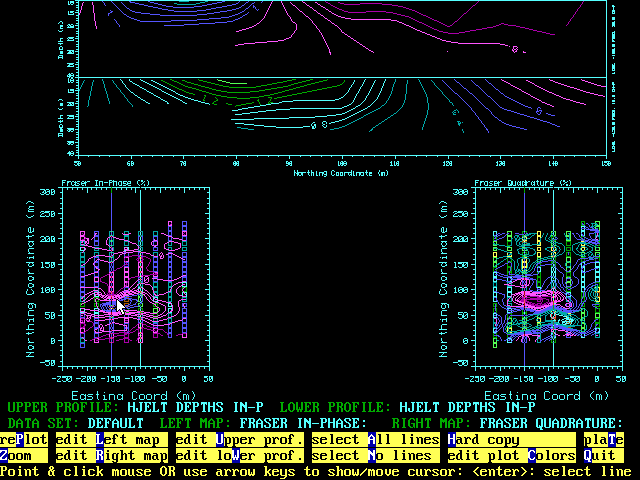
Interactive Graphics Screen showing contour map of data wit Hjelt Depth Sections of selected profiles
EMIX VLF also allows for the export of plot and grid files to IXCAD. IXCAD enables users to edit and annotate the plot files, shade the grid files as color or grayshade images.
![]()
EMIX MM Plus allows for forward and in-verse modeling of EM data acquired with instruments such as the SCINTREX EM-4 GENIE/HLEM or APEX Parametrics MAX-MIN systems in terms of layered earth models and thin plate conductors. EMIX MM PLUS can interpret data from both the MAXMIN and GENIE systems.
The total number of layers for layered earth models are 7. The program calculations allow for VARIABLE coil spacings- and also takes the instrument height into consideration. A floating constant compensate for the spacing errors in TX and RX separation.
EMIX MM
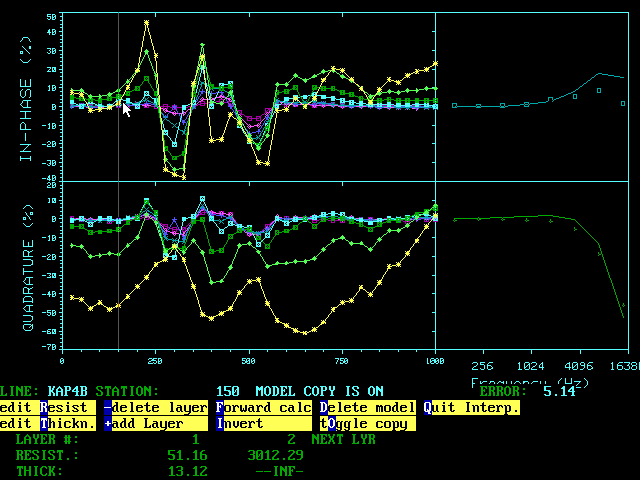
Interactive Graphics Screen showing profile data and layered model results
EMIX MM
The Genie option was developed to accommodate the measurements of
the Scintrex Genie HLEM Instrument. This instrument is useful in rugged terrain, since it
measures total field at two frequencies and combines them to form the "Genie
Anomaly". In addition to allowing EMIX MM
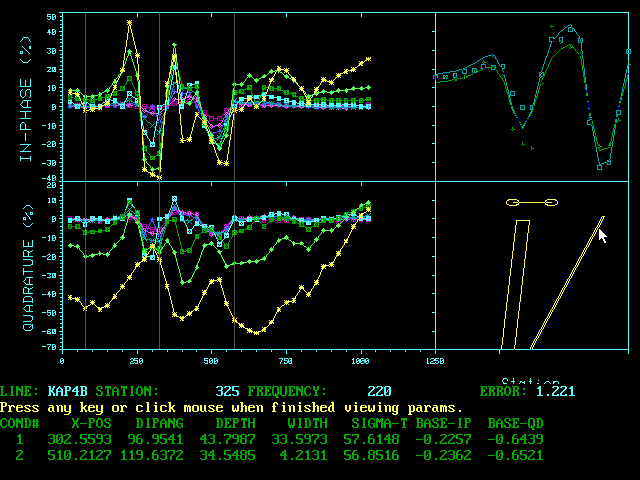
Interactive Graphics Screen showing profile data with interpreted conductor models
The dip, depth and conductance of the thin sheet are specified, and the argand diagrams are interpolated to find the in-phase and quadrature values. The Wesley algorithm is used to find the curve shape, using the depth and the angle. The curve is then scaled to yield the in-phase and quadrature responses.
In case of the Genie, this is done for the low and the high frequencies and combined to form the Genie Anomaly. This means a starting model can be specified, or manually interpret without using inversion is possible. It also means that there is a single interpretation for dip angle and width. There is no longer a need to edit the argand interpretation, since there is now a forward modeling mode.
The response for conductor models can be calculated for all the frequencies without copying the conductor to all the frequencies, effectively "filling" in the synthetic data with the response from the selected conductors. The program does a forward calculation of the conductors to adjust for the frequency and then an inversion to adjust for the base values. Conductors can also be copied specified frequencies.
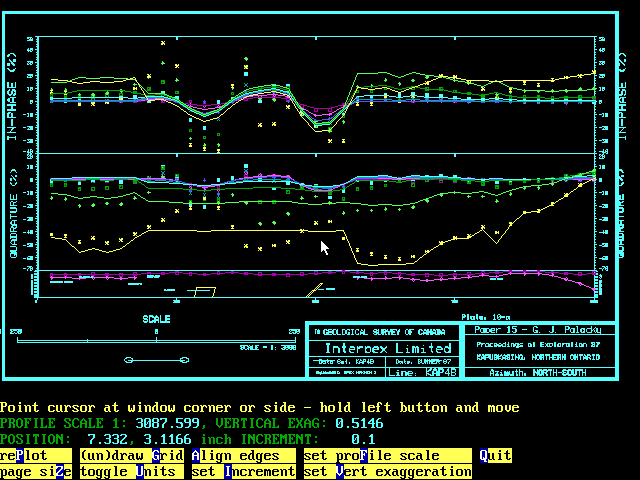
Plot of profile data and synthetic calculated responses for both layered earth and conductor models. The bottom window shows the appropriate models with labels that was added using the interactive label option.
Calculated layered earth responses or "filled" conductor responses from the field data can be "removed" from the data by subtracting the synthetic responses from the field data.