|
|
|
Interpex is a software company dedicated to the production of high quality software for the processing, interpretation and display of geophysical data. |
|
P.O. Box 839 •
Golden • Colorado • 80402 • USA |
This site does not use cookies. We do not collect any personal information on this site.
Home Marine EM Seismic Processing Custom Development DOS Support
|
Electrical Methods |
Other Methods |
Support |
Updates |
Miscellaneous |
||
|
|
|
|
VLF Data Presentation and Processing Package Designed
for Windows 9x and NT ® IXVLF is the successor to EMIX VLF, our DOS based VLF data processing and presentation system. New is the addition of user defined labels To evaluate this package, download and install the software and run it with the demo data set. Be sure to open and peruse the HELP file. Contact Interpex with any questions. Data Import –
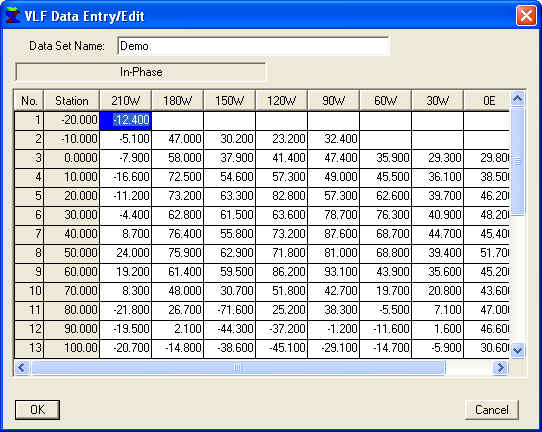
MATHEMATICAL BASISApart from displaying VLF data IXVLF provides the user with two data filters. The FRASER filter converts cross-overs of the correct polarity into peak responses by differencing successive values of the tilt-angle along the survey profile. The HJELT filter profiles are obtained by using the linear fit theory to solve the integral equation for the current distribution, assumed to be located in a thin horizontal sheet of varying current density, situated everywhere at a depth equal to the distance between measurement stations. IXVLF was designed to read inphase and quadrature VLF data from instruments and files into a grid based data set. Easy to use editors allows for keyboard entry of data collected on a non digital instrument or for the editing of recorded data. Data sets are then saved in a binary file for quick and easy retrieval. IXVLF has no restriction on the number of lines or number of stations allowed per line. Having said that, the spreadsheets are presently limited to 1000 stations, but this can be changed.
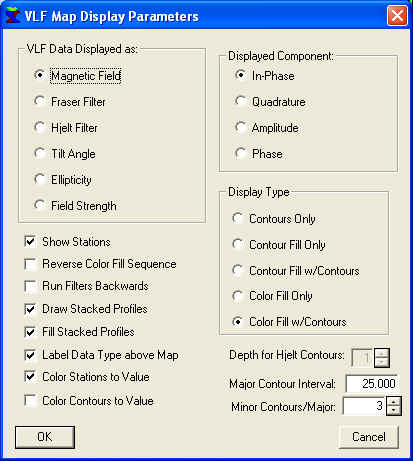
IXVLF™ Data Editing Spreadsheet. The program allows for the export of VLF data into XYZ ASCII files. The main feature of IXVLF is the interactive graphics viewing screens. The first option is the single map view that allows the user to view a contour map of any of the following datasets/components:
IXVLF™ Map view display dialog. The map can be customized to show various fields/components, and to control color fill, contour fill, stacked profiles and colorizing stations and contours. Clicking on a line will toggle its display on the profile plot. When stations are displayed, clicking on a station will display the line containing that station on the profile display
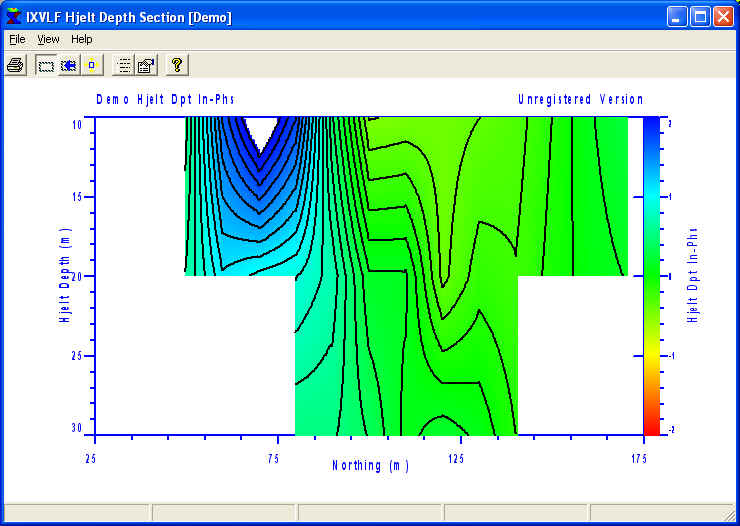
One, several or all profiles can be displayed on the profile display Right-clicking on a station will display
the line containing that station as a Hjelt depth section.
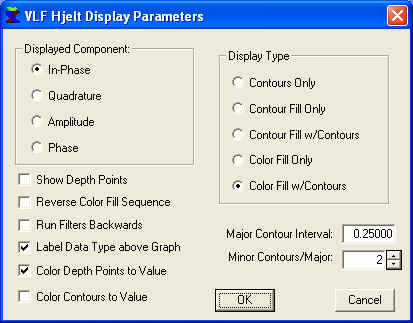
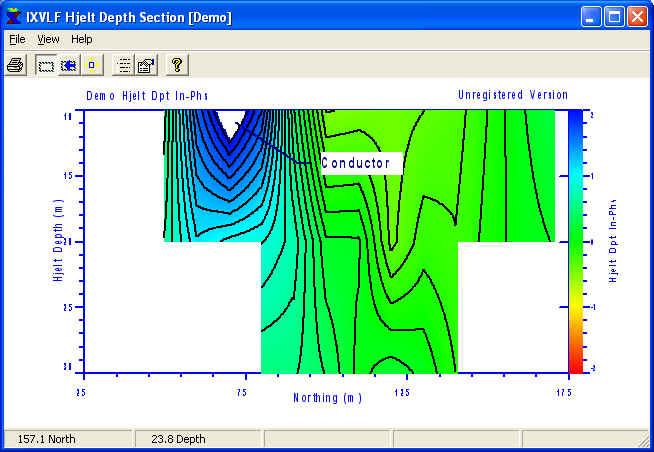
Hjelt depth section window with color fill and contours The Hjelt depth section has a separate control for manipulating the display:
A separate dialog controls the display of the Hjelt Depth Section Right-clicking allows for creating labels. Labels can be moved, resized and the text can be edited. Also, an arrow can be drawn or not.
Labels can be created by right-clicking on any graph. They can be displayed with or without an arrow. |
||
Copyright © 2018 Interpex Limited. All Rights Reserved