|
|
|
Interpex is a software company dedicated to the production of high quality software for the processing, interpretation and display of geophysical data. |
|
P.O. Box 839 •
Golden • Colorado • 80402 • USA |
This site does not use cookies. We do not collect any personal information on this site.
Home Marine EM Seismic Processing Custom Development DOS Support
|
Electrical Methods |
Other Methods |
Support |
Updates |
Miscellaneous |
||
|
|
|
|
Seismic
Refraction processing and interpretation using GRM Designed
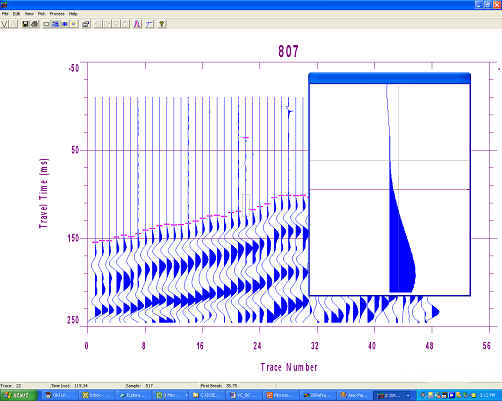
for Windows 9x and NT ® IXRefraX is the successor to GREMIX and FIRSTPIX, our DOS based seismic refraction data processing and interpretation system. It combines the features of both packages in one integrated system and adds bold and powerful new ideas and features! New is the simple 2-D forward and inverse modeling. This is designed mostly to automate the GRM interpretation by providing a means of assigning arrivals to layers and determining X-Y values and reciprocal times (where data cannot estimate them). However, the forward and inverse modeling can be used to interpret data sets which lack the redundancy required for GRM interpretation. To evaluate this package, download the tutorial and run it. It is a PowerPoint PPS file. Then, download and install the software and run it with the demo data set. Be sure to open and peruse the HELP file. Contact Interpex with any questions. Data Import – RAW Shot Record Trace Data
IXRefraX™ screen showing a shot record with amplified window near first break pick. First Break Picking
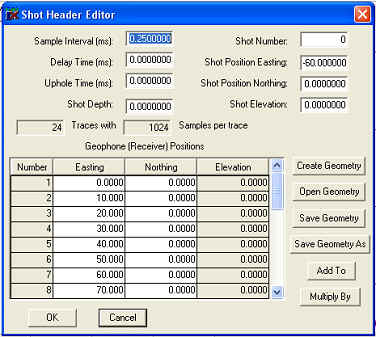
IXRefrax™ Shot header editor can save, open move or generate geometry of spread. Shot and geophone spread geometry is read from shot record files as available. Geometry can be created simply and easily and then saved for further use. Addition and multiplication functions allow for shifting and manipulating of existing spread geometries.
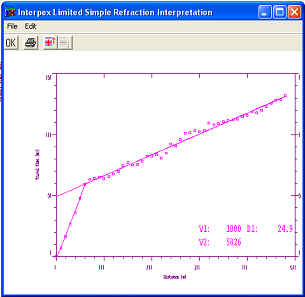
Travel time curves can be automatically interpreted using slope-intercept methods. It is useful to have some information about the earth structure to construct a starting model for the 2-D inversion. Automatic slope-intercept interpretation allows for quick estimates in cases where the earth is relatively flat. Knowledge of ground truth is also useful to have.
Starting with a model which is flat or mimics the topography, inversion methods develop a result that fits the data closely enough to assign arrivals automatically. Once a general idea of the velocities and
depths is conceived, this is used to generate a starting model which is
perfected by inversion to get a reasonable fit to the data. The resulting
model is then used to assign arrivals to layers and estimate reciprocal
times for shot pairs which do not have valid estimates from the data
values themselves.
Model screen showing ray paths from sources to receivers The simple 2-D model can generate ray paths to illustrate the sampling of the subsurface by the rays which give rise to the travel time data. The forward and inverse modeling can be used to interpret data which lack the redundancy required for GRM interpretation.
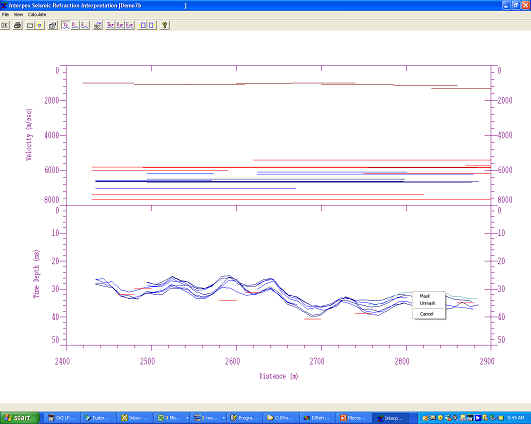
The GRM interpretation is automatically generated and the individual segments are presented to the user for perusal, editing, masking and evaluation Each shot position is used to build as large a shot record as possible using all data recorded from that shot position. These are combined in forward-reverse pairs to generate segments which are then interpreted using GRM and presented for evaluation by the user. Segments can be masked (rejected for use in the combined section), the reciprocal time can be edited, arrivals can be reassigned and even the first breaks for the shots used in generating the segments can be repicked.
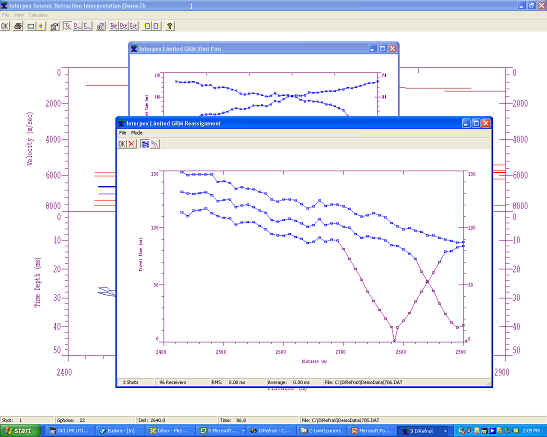
Once the GRM interpretation for all shot pairs is compiled, inconsistencies among interpretations for different segments can be investigated, even back to the first break picks on the original shot records. Once the data has been examined and edited by the user, the GRM interpretation can be regenerated.
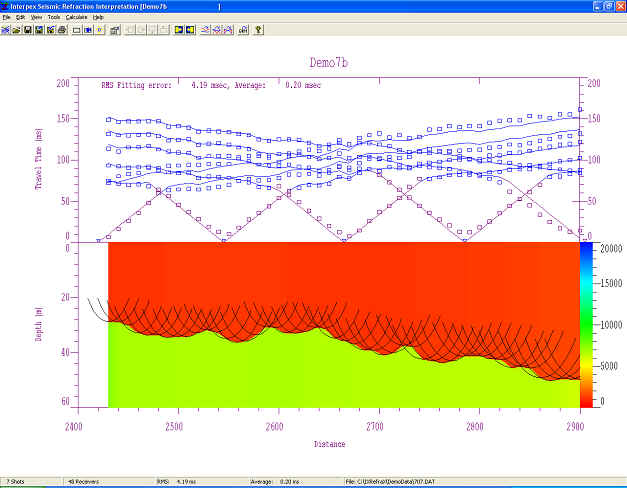
Interpreted depth section showing color fill of velocity and arcs for consistency.
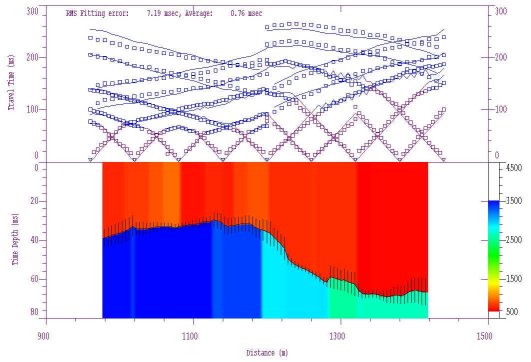
Data and Depth section view showing error bars on depth estimates. Error bars are calculated when interpreted GRM segments are
averaged and presented on the graphical display in the depth and elevation
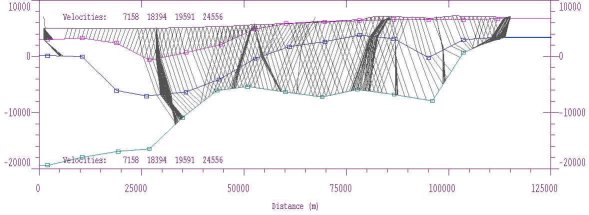
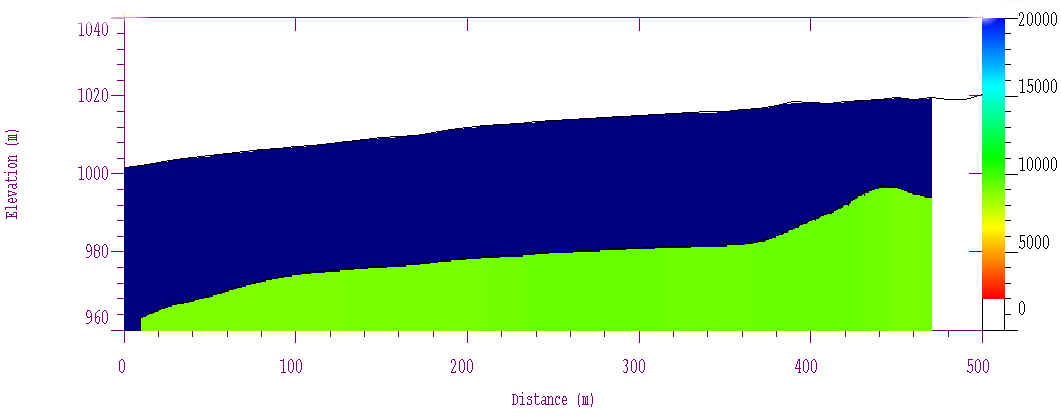
sections. Elevation section showing color coded velocities. The user has control over the color coding of the velocities so that each section is colored in the same way for comparison.
XYZ file output showing map and profile coordinates with velocities, depths, elevations and time-depths. ASCII file output of interpreted GRM results can be generated in an XYZ format for importation into third-party software. User has control over output of map and/or station coordinate output, as well as control over output of velocity, depth, elevation and/or time-depth values. Licensing and DistributionIXRefraX is distributed as copy-protected software. The software can be downloaded and it works fully only with the demo data supplied. The license allows for a 30-day evaluation period. After the evaluation you are required to purchase the package in order to continue using it. Purchase price is US$1,499.00. Licenses are offered with your choice of USB or Parallel key. Licensed VersionsLicensed users can obtain e-mail support by sending requests for assistance, bug fixes and feature enhancements to info@interpex.com Please include the serial number, version number and attach the files with which you are having problems to your e-mail request. The newest version can be downloaded from this website and will work with your licensed hardware key. Updates are free if you download them from our web site. Please download the newest version before you contact technical support. There may be an update that fixes the problem you are having.
|
||
Copyright © 2018 Interpex Limited. All Rights Reserved